USDA Releases 2023 Plant Hardiness Zone Map: A Guide for Wildlife-Friendly Gardening


Understanding the Significance of the USDA Plant Hardiness Zone Map
In a pivotal moment for gardeners and researchers alike, the U.S. Department of Agriculture (USDA) has unveiled the highly anticipated 2023 version of its Plant Hardiness Zone Map (PHZM). This robust tool, developed in collaboration with Oregon State University's PRISM Climate Group, represents a leap forward inaccuracy, detail, and user accessibility.
The USDA Plant Hardiness Zone Map serves as a fundamental guide for gardeners, offering insights into the climatic conditions of specific regions. This, in turn, empowers individuals to make informed decisions about the types of plants that are most likely to thrive in their local environments. With the 2023 map, the USDA continues its commitment to providing accurate and detailed information that aligns with the evolving needs of gardeners and researchers.
What's New in the 2023 USDA Plant Hardiness Zone Map?
The 2023 map, available online, introduces several notable features that set it apart from its predecessor. One of the most significant advancements is the increased precision in delineating zones, particularly in Alaska. The map now provides a more detailed resolution for Alaska, offering a quarter-square-mile area of detail compared to the previous 6 ¼ -square-mile resolution. This improvement is crucial for gardeners in Alaska, where diverse topography and climate variations necessitate a finer level of detail.
Moreover, the 2023 map incorporates data from 13,412 weather stations, a substantial increase from the 7,983 stations used in the 2012 version. This influx of data enhances the overall accuracy of the map, providing gardeners with a more reliable tool for plant selection. The map's rendering for Alaska is notably warmer than the 2012 version, reflecting the inclusion of data from the state's mountain regions. In these areas, warm air often overlies cold air in winter, leading to comparatively higher temperatures.
Photos by USDA
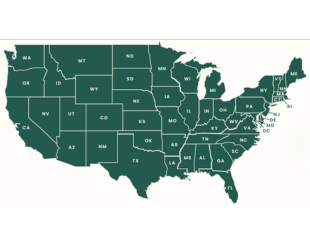
OLD MAP

2023 USDA Plant Hardiness Zone Map

New Interactive Features and User-Friendly Design
One of the standout aspects of the 2023 map is its Geographic Information System (GIS)-based interactive format. This user-friendly design allows gardeners and researchers to navigate the map with ease, accessing detailed information about specific regions. The online platform provides a seamless experience, making it a valuable resource for individuals seeking to understand the hardiness zones of their gardening locales.
In addition to the map updates, the Plant Hardiness Zone Map website has expanded in 2023 to include a "Tips for Growers" section. By bridging the gap between research and practical application, the USDA aims to empower individuals to make informed choices about their plant selections and growing practices.
Implications for Wildlife-Friendly Gardening
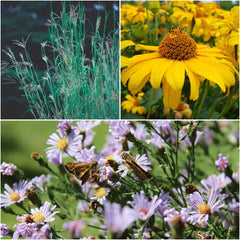
For wildlife enthusiasts and those aspiring to create gardens that harmonize with local ecosystems, the 2023 Plant Hardiness Zone Map is a treasure trove of insights. Native plants play a pivotal role in supporting biodiversity, providing habitats, and attracting pollinators. The map serves as a guide for identifying native plants that align with the specific hardiness zones of a region. You can also search native plants by state or zip code with Garden for Wildlife.
Approximately 80 million American gardeners and growers frequently consult the USDA Plant Hardiness Zone Map. These individuals represent a diverse community with varied interests, but a common thread among them is the desire to cultivate gardens that thrive in their unique environments. The map acts as a unifying tool, offering a shared language that transcends regional differences.
The Role of Native Plants in Wildlife-Friendly Gardens
Native plants are the unsung heroes of wildlife-friendly gardens. Their evolutionary history and adaptation to local conditions make them well-suited for the ecological niches they inhabit. The 2023 map aids gardeners in identifying native plants that not only survive but also flourish in specific hardiness zones.
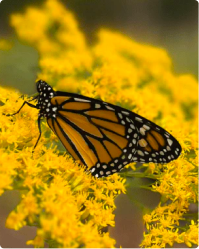
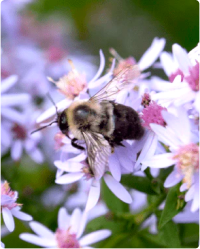
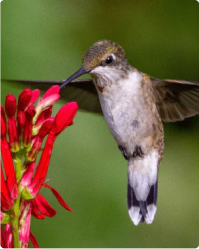
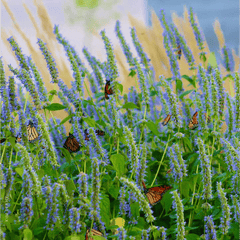
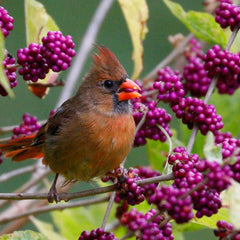
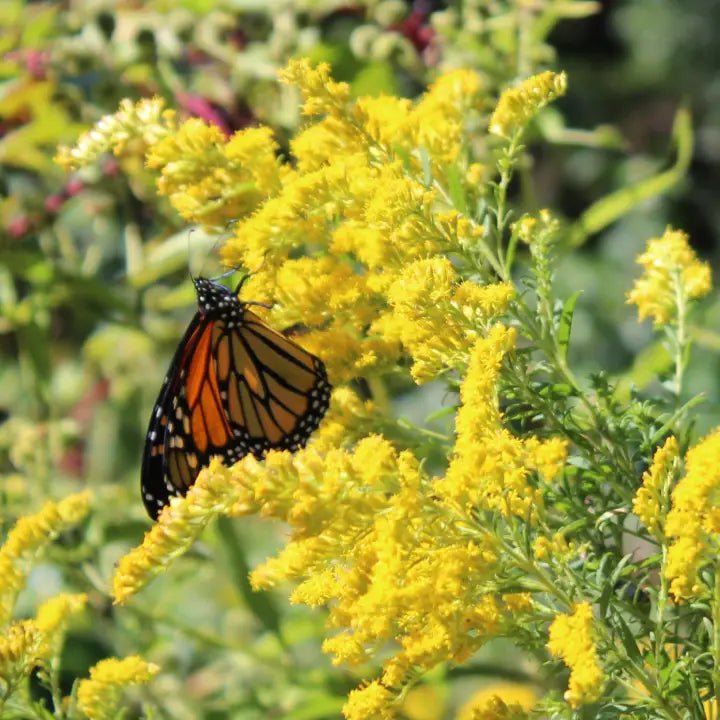
One need not look further than the vibrant array of colors found in native flowers to understand their allure to pollinators. The map, by guiding gardeners to select plants native to their zones, indirectly promotes the creation of environments that support local fauna. Whether it's the fluttering wings of butterflies or the hum of bees and hummingbirds, native plants contribute to the vitality of wildlife-friendly gardens.
A Closer Look at Plant Hardiness Zones
Understanding the concept of plant hardiness zones is key to successful gardening. These zones represent the "average annual extreme minimum temperature" at a given location during a specific 30-year period. It's important to note that these designations don't reflect the coldest temperature ever recorded but rather the average lowest winter temperature over the specified time frame.
With 13 zones across the United States and its territories, each zone is further divided into half zones, labeled as "A" and "B." For instance, zone 7 is divided into 7a and 7b half zones. Comparing the 2023 map to its 2012 counterpart, we observe that about half of the country has shifted to the next warmer half zone. This indicates a warming trend of approximately 0-5 degrees Fahrenheit in those areas. However, the other half of the country has remained in the same half zone, suggesting that while there may be overall warming, it's not uniform across the entire nation.
The Influence of Temperature Updates on Plant Hardiness Zones
The updates to the plant hardiness zones are a result of incorporating data from a more recent time period. The 2023 map includes temperature data measured at weather stations from 1991 to 2020. This shift in time frame, coupled with advancements in mapping methods, contributes to the nuanced changes observed in zonal boundaries.
It's crucial to recognize that these updates in temperature and zones are not necessarily indicative of global climate change. The extreme minimum temperature, which the zones represent, can vary significantly from year to year based on local weather patterns. The plant hardiness zones are, therefore, more reflective of localized climatic conditions rather than long-term global trends.
The Varied Applications of the USDA Plant Hardiness Zone Map
While gardeners form the largest demographic of users for the USDA Plant Hardiness Zone Map, their needs are not the only considerations. The map's plant hardiness zone designations serve as a reference for various applications beyond gardening. For instance, the USDA Risk Management Agency relies on these designations to establish certain crop insurance standards.
Researchers, too, integrate plant hardiness zones into diverse models, such as those predicting the spread of exotic weeds and insects. The zones become a data layer in these models, aiding scientists in understanding the potential impact of climatic conditions on the distribution of species.
Looking Beyond the Numbers
As we navigate the nuances of the 2023 USDA Plant Hardiness Zone Map, it's essential to view the data in context. The map represents a snapshot of climatic conditions over a specific period, offering valuable insights into the adaptability of plants in different regions. However, it is not a crystal ball predicting future climate trends.
The cautionary note from map developers regarding the interpretation of temperature updates as indicators of global climate change is a reminder of the complex nature of climate science. Global climate change is a multifaceted and dynamic phenomenon that involves long-term shifts in temperature patterns, precipitation, and other climatic variables on a global scale. While the USDA Plant Hardiness Zone Map provides a localized perspective on climate conditions, the broader context of global climate change extends beyond the scope of this mapping tool.
Find Native Plants by Zip Code
We took the guesswork out of planting native. Check your zip to see what ships!
